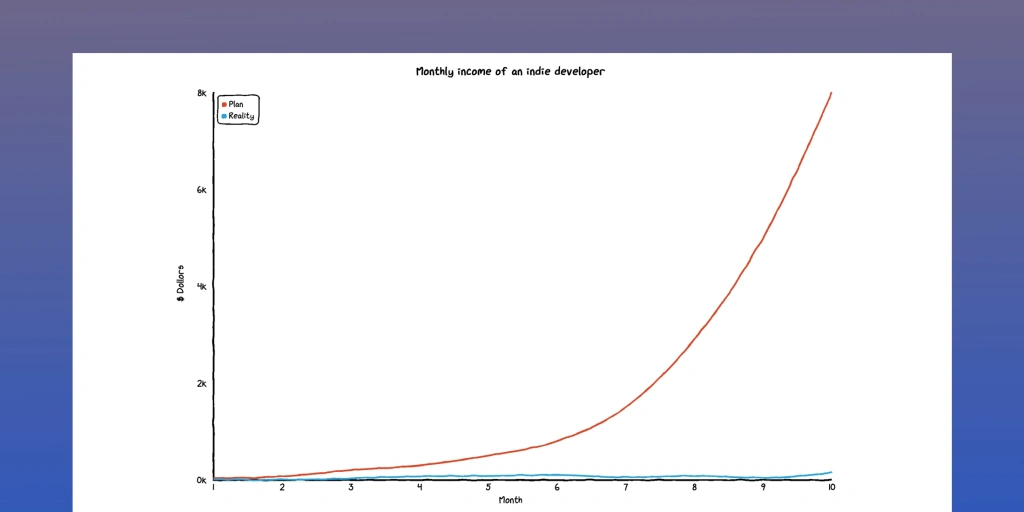
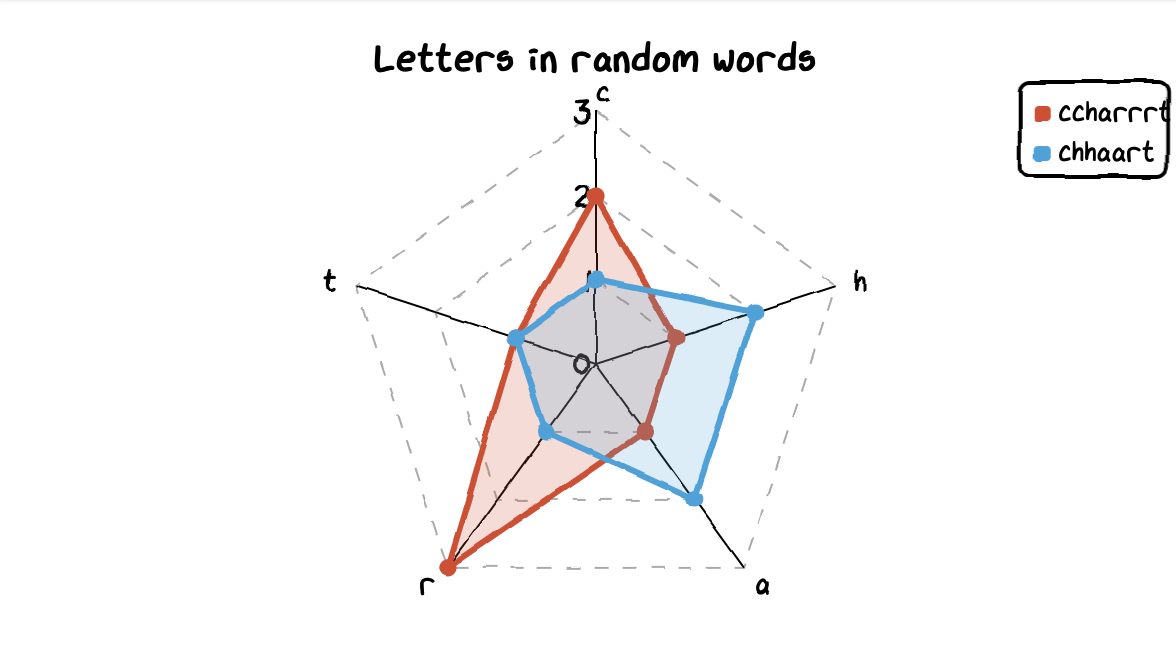
Chart.xkcd is a chart library plots “sketchy”, “cartoony” or “hand-drawn” styled charts.
Installation is simple via npm:
npm i chart.xkcd
and usage:
import chartXkcd from 'chart.xkcd';
const myChart = new chartXkcd.Line(svg, {...});
Chart.xkcd supports line charts, bar charts, pie charts, and more. If you’d like to find out more about this charting library visit the official documentation.


Leave a comment